

3rd Swiss Viz Awards
Celebrating Excellence in Data Visualization in Switzerland
November 21, 16:30h Convention Center - Circle Zurich Airport
Swiss Viz Award 2025: The Winners
Gold
“Schweizer Bergwelten - 100 Infografiken mit Weitsicht”
By Fabian Lang

-
The Gold Award goes to Fabian Lang for his book “Schweizer Bergwelten - 100 Infografiken mit Weitsicht”.
His work transforms remarkable yet often unseen data, information, and imagery about the Swiss mountains into engaging visual stories, data visualizations, infographics, and maps. We salute this remarkable collection of one-pagers for achieving a rare harmony of depth and beauty, and we recognize the extraordinary work required to remain consistent yet boldly innovative. Congratulations!
Silver
Women in Politics
By Hahn+Zimmermann and Katja Vock

-
The Silver Award goes to Hahn+Zimmermann and Katja Vock for their self-initiated work on Women in Politics. This cross-media project visualizes the evolution of women’s representation in parliaments worldwide through an interactive digital experience complemented by social media and physical extensions that connect data to everyday life.
We salute the bold, multichannel concept that blends scrollytelling, interactivity and calls for action. It inspires curiosity, and redefines how we connect with public information. Congratulations!
Bronze
2024 Migration Reports
By Emphase GmbH for the State Secretariat for Migration SEM.

-
The Bronze Award, awarded to Emphase GmbH for the 2024 Migration Reports for the State Secretariat for Migration SEM.
The annual digital Migration Report turns complex migration statistics into accessible, visually engaging narratives through interactive storytelling and data visualization.
We appreciate the scrollytelling journey that makes data accessible and enjoyable to explore with smooth navigation, multilingual reach, and open-data spirit. It welcomes everyone to discover and learn. Congratulations!
The Swiss Viz Award was created three years ago to give the Swiss data-visualization community a stronger voice and a place to connect and inspire one another.
We’re thrilled to see how it continues to grow, with this third edition receiving 50% more submissions than last year.
We want to thank you for your creativity and dedication that are what make this award not only possible, but truly inspiring.
Public Lens
Operational Insight
Gold
GAiAPSE
By Jean-Baptiste Mignardot & Emmanuel Pignat for Sophia Genetics

-
The Gold Award goes to Jean-Baptiste Mignardot & Emmanuel Pignat for GAiAPSE created for Sophia Genetics. This platform transforms complex global operational data about genomic profiles and healthcare institutions into an interactive 3D experience that delivers clear, data-driven insights for strategic decision-making and public engagement.
This visualization does more than inform, it inspires, and engages. With openness about its methods and outstanding visual quality, it’s a powerful tool for communication and action. Congratulations!
Silver
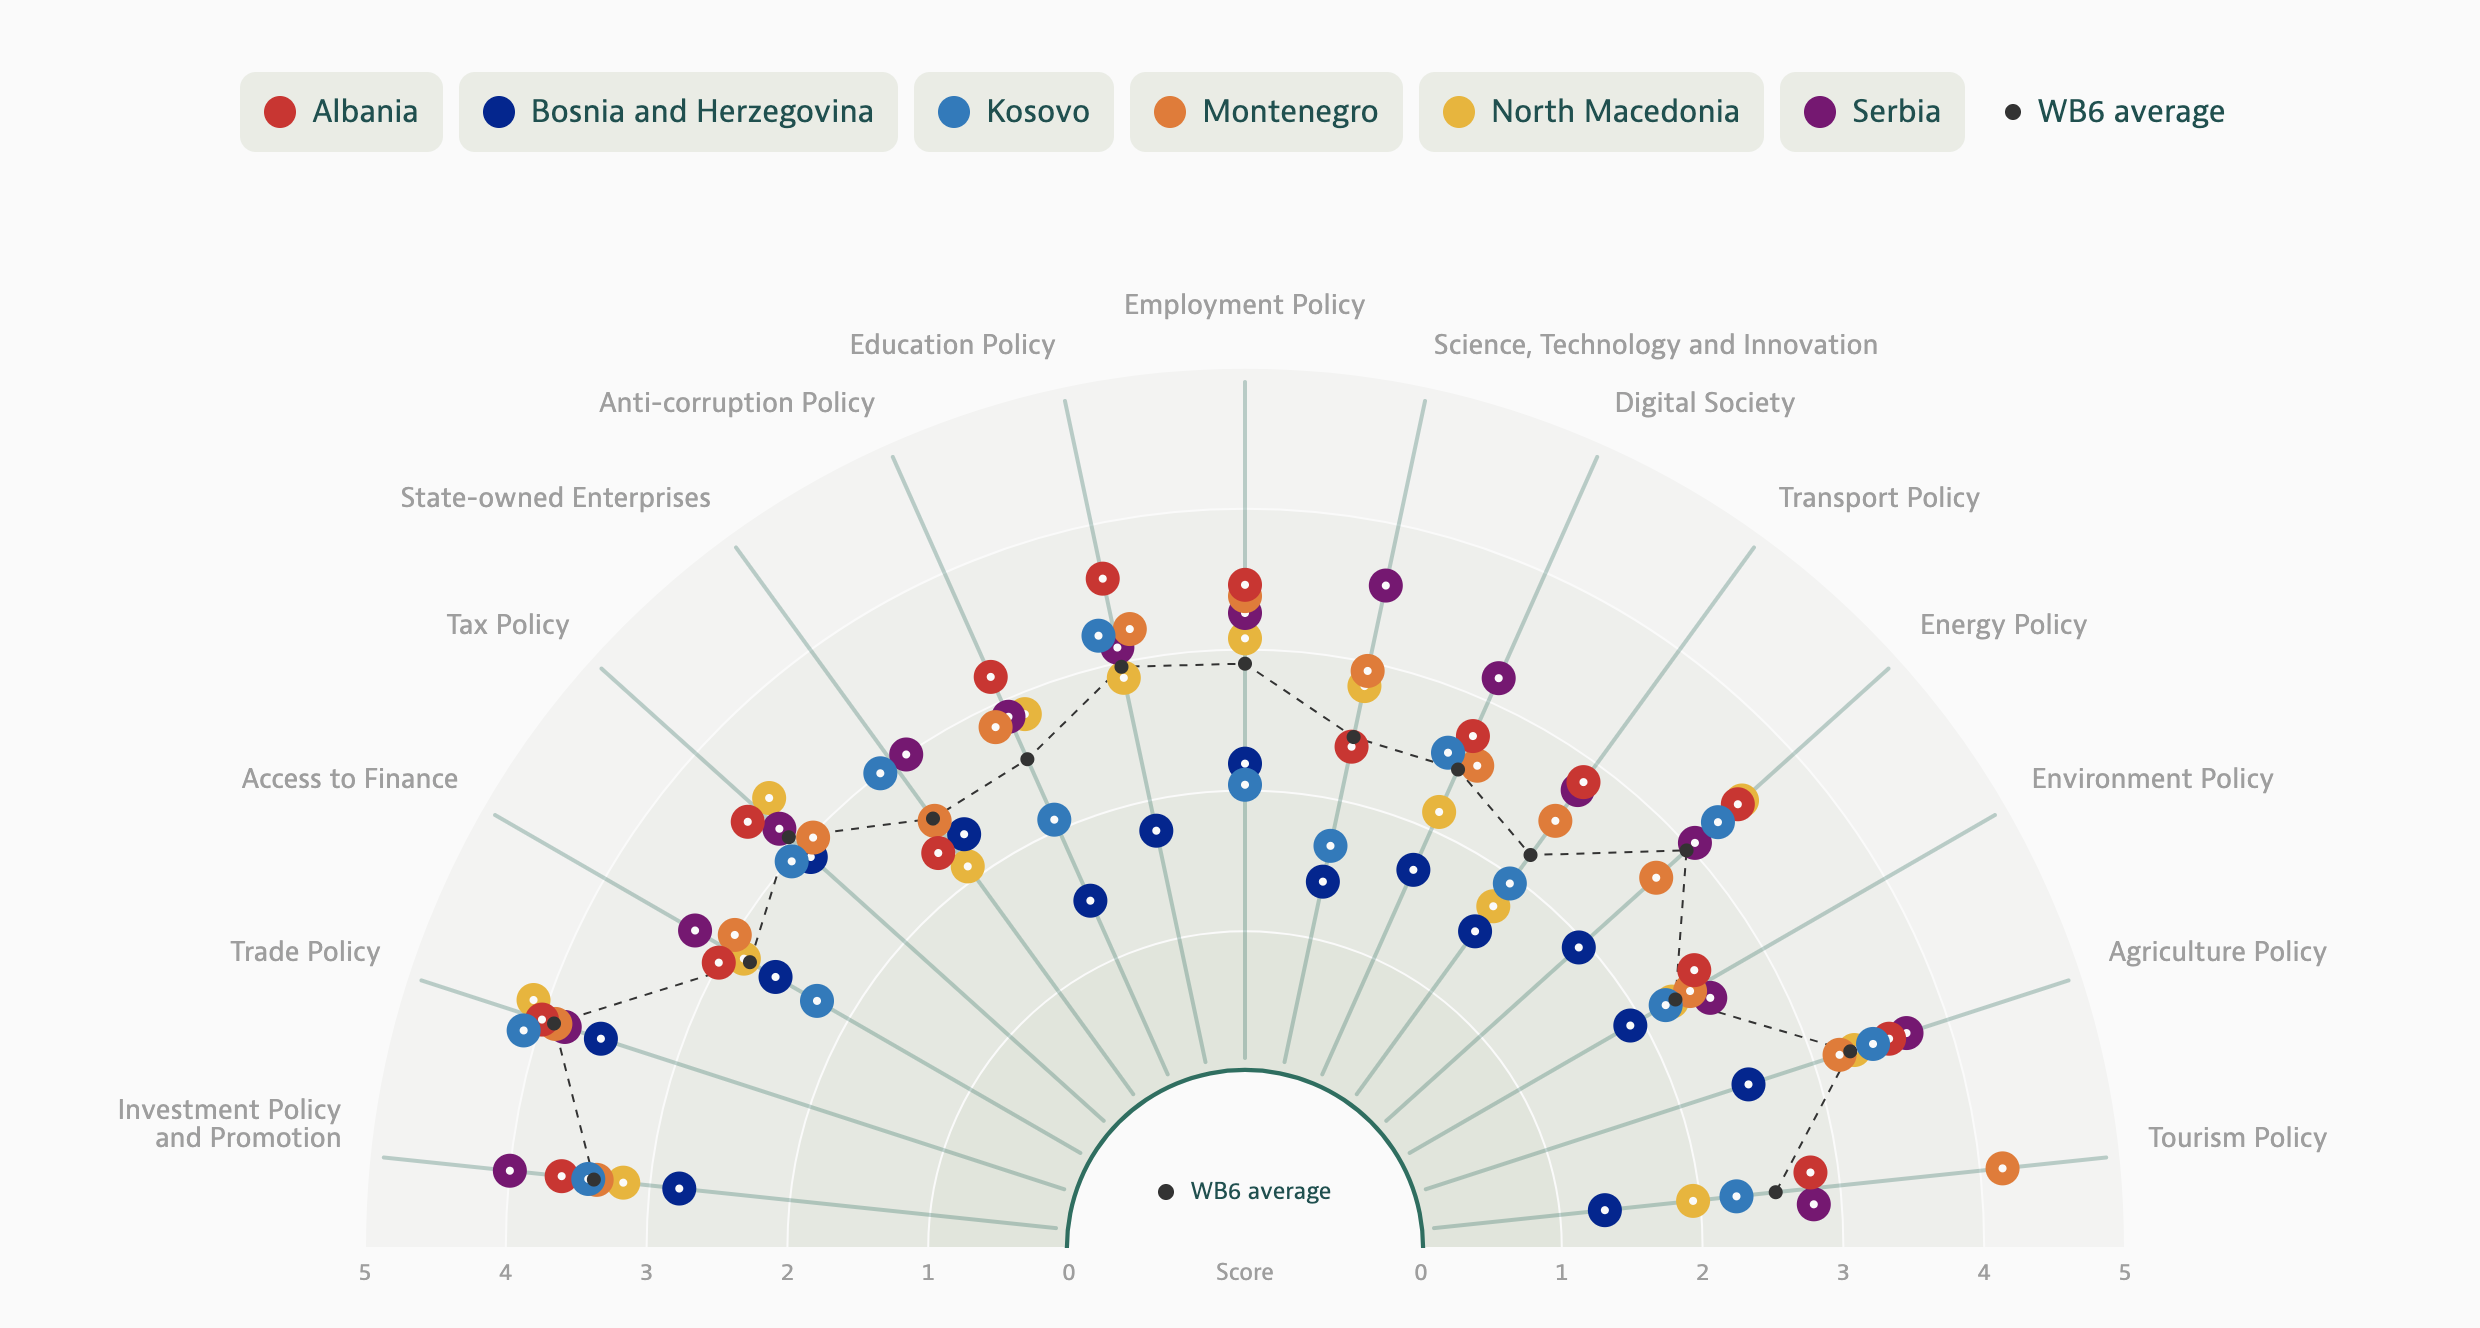
The Western Balkans Competitiveness Data Hub
By Christoph Schmid, Florencia Kühne, Lloyd Richards, Michael Schönenberger, Tania Boa and Tomáš Čarnecký from Interactive Things for the OECD
Case Site: https://westernbalkans-competitiveness.oecd.org/
-
The Silver Award goes to Christoph Schmid, Florencia Kühne, Lloyd Richards, Michael Schönenberger, Tania Boa and Tomáš Čarnecký from Interactive Things for the Western Balkans Competitiveness Data Hub. Their work turns the OECD’s Competitiveness Outlook into an interactive platform that makes regional economic reforms more transparent and actionable through visual, data-driven insights.
We value the clear and consistent presentation of complex information, elevated by flawless execution and bold new half ‘spiderweb’ charts. The storytelling, drill-down paths, and multi-angled access make the experience inviting and encourage users to explore further. Congratulations!
Bronze
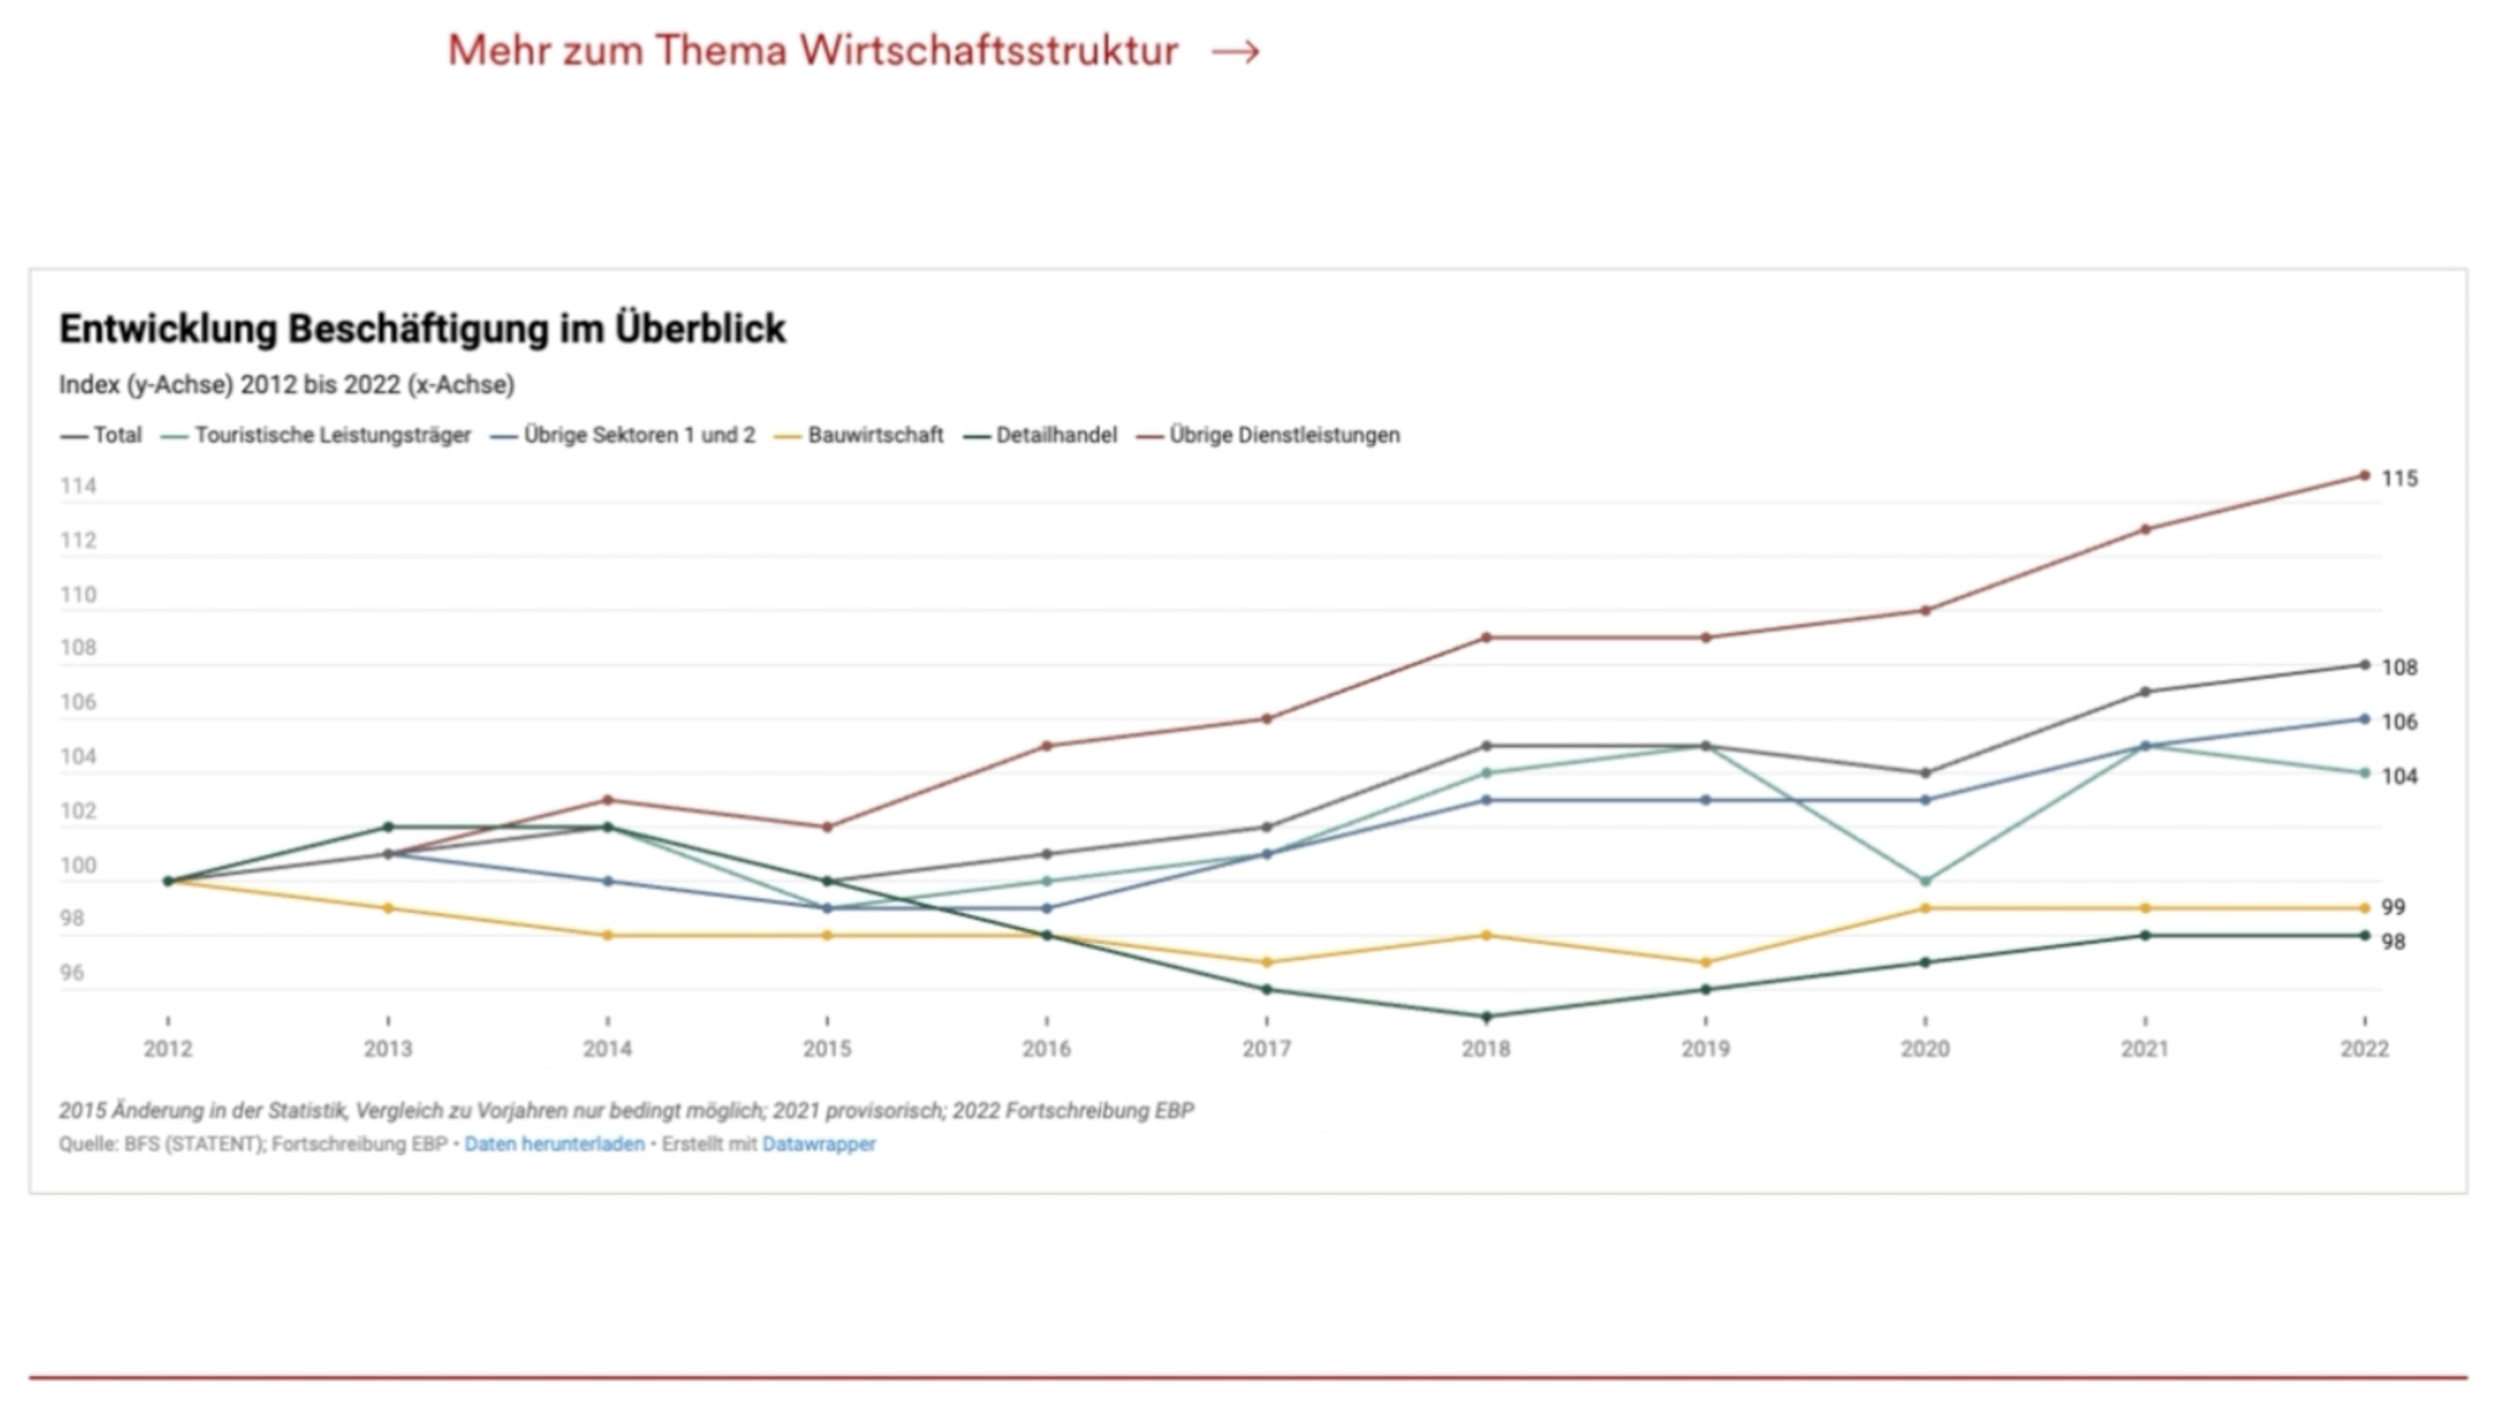
Wertschöpfungsstudie. Tourismus Graubünden
By Noa Spörri, Tonio Schwer, Philippe Lehmann, Gina Burkhard, Claudio Fornito and Sarah Schöni from EBP Schweiz AG for the Office for Economics Affairs and Tourism of the Canton of Grisons
-
The Bronze Award, awarded to Noa Spörri, Tonio Schwer, Philippe Lehmann, Gina Burkhard, Claudio Fornito and Sarah Schöni from EBP Schweiz AG for their visualisations for the Office for Economics Affairs and Tourism of the Canton of Grisons. Their work highlights the economic importance of tourism in the Canton of Grisons through insights from over 30,000 surveys, presented in an interactive web report that informs political dialogue and future development.
We salute the accessibility and transparency of the work in terms of methodology, data and design. It truly transforms complex information into actionable insight and shows how data can drive decision-making. Congratulations!
Experimental - Avant-Garde
Gold
“Klingende Werte”
By Charis Arnold

-
In this category, the Gold Award stands alone and goes to Charis Arnold for her work “Klingende Werte”. A year-long self-experiment exploring how personal health data can be understood and expressed through the use of innovative visualizations, animation, and sound.
This daring and imaginative piece fuses sound and visuals into a singular experience. Bold, inspiring, and mesmerizing - a creation that makes us pause and listen. Congratulations!
Student
Gold
Hurricanes – A History of Wind and Water
By Elisee Kukulu and Eva Sanneke Brinksma -
Data Design and Art at HSLU

-
The Gold Award goes to Elisee Kukulu and Eva Sanneke Brinksma for «Hurricanes – A History of Wind and Water». This interactive installation visualizes the link between rising sea temperatures and North Atlantic hurricane activity using historical and oceanographic data.
It excels at using immersive sounds and visuals to draw viewers in as they explore the data — helping them understand how the two things are connected. Congratulations!
Silver
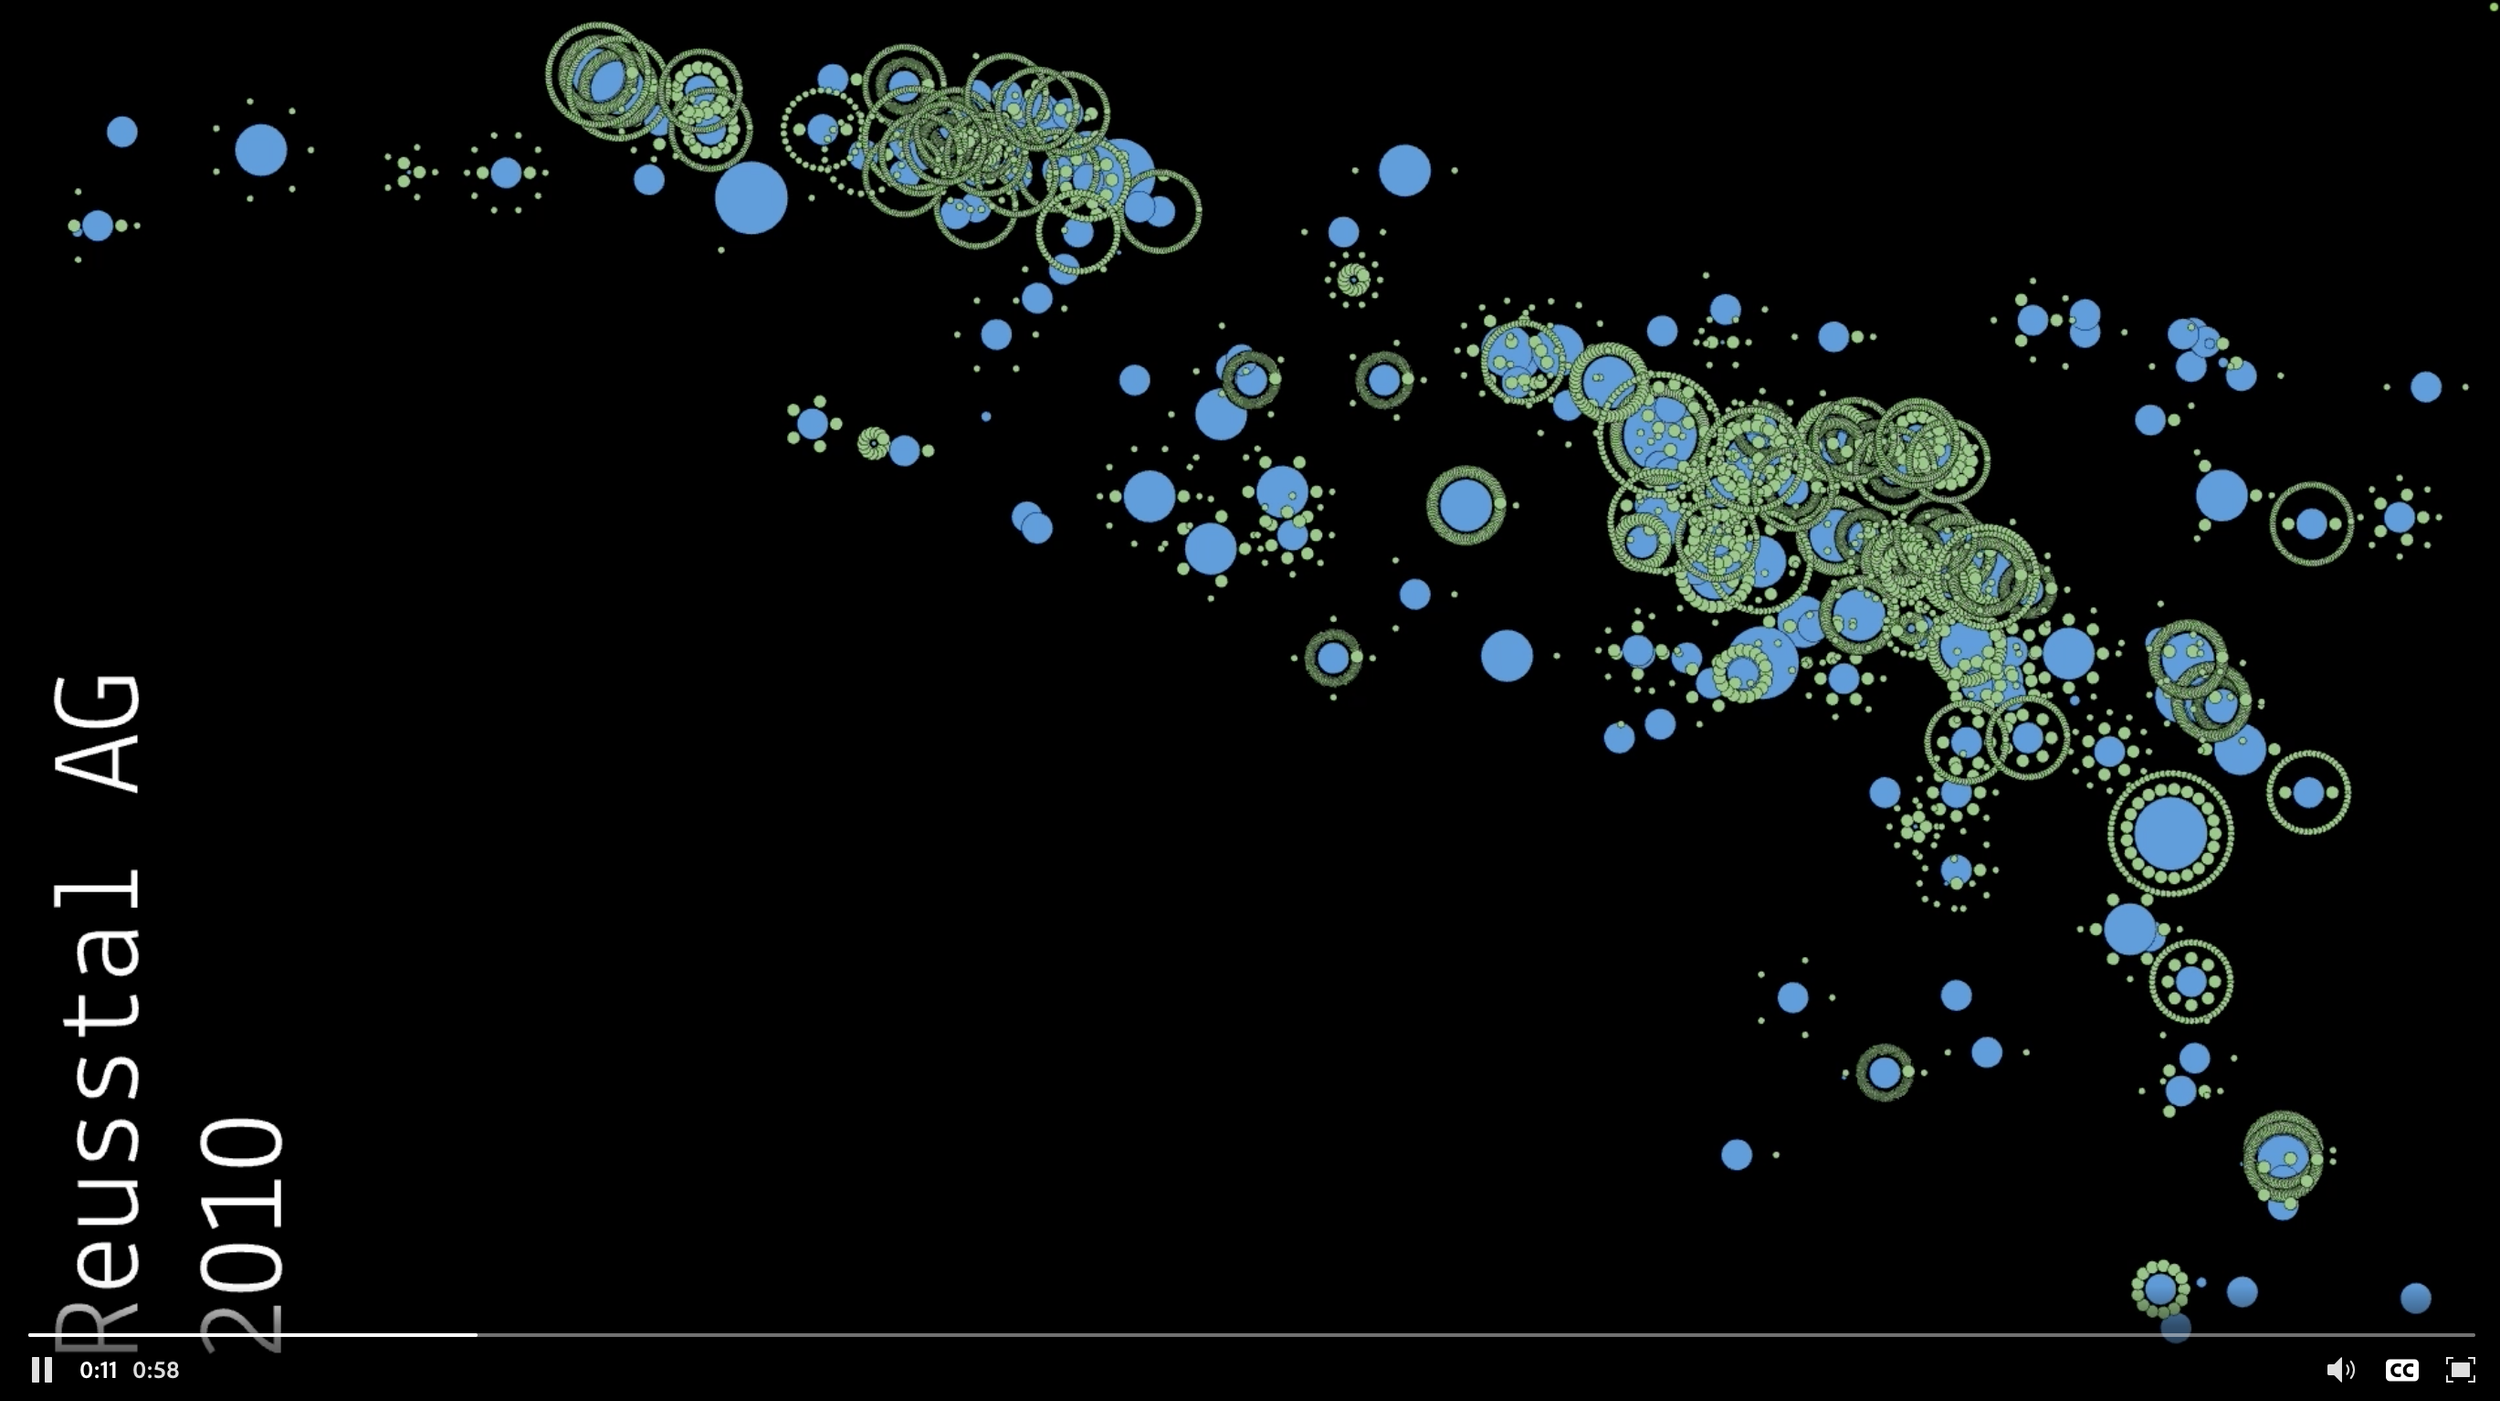
Reviving Ponds: a Better Future for Amphibians
By Jill Amber Kaser and Danielle Urech -
Data Design and Art at HSLU
-
The Silver Award for Jill Amber Kaser and Danielle Urech for “Reviving Ponds: a Better Future for Amphibians”. An interactive installation using 20 years of habitat restoration data in the Swiss Reusstal region to let users experience amphibian population recovery through an interactive, spatial visualization.
We appreciate how this innovative, interactive, and intuitive installation makes the viewers acutely aware of the influence their actions have on the world around them. Congratulations!
Visualization plays a pivotal role in the data journey.
It imparts knowledge and understanding, influences perception, guides decisions – and sparks inspiration.
Strengthening the discipline of data visualization is essential on two fronts:
1.
Fostering a diverse and vibrant community, including industry professionals, renowned experts, and students.
2.
Raising public awareness of the value of visualization across a wide range of fields.
In collaboration with the Data Innovation Alliance, the Swiss Viz Awards bring together data enthusiasts who are passionate about how data is represented and experienced visually.
These awards not only recognize exceptional works and authors each year – they also help promote the discipline to a broader audience.


Categories – What kind of work can be submitted?
We accept submissions created in or related to Switzerland and published in 2024 or Q1 2025. You can submit in one of the following categories:
Public Lens
Visualizations designed for broad public engagement. These works are accessible, compelling, and created to inform or inspire a general audience. They address societal, cultural, or global themes, and are often found in newsrooms, advocacy work, or open data storytelling.
Operational Insight
Visualizations created within institutions, organizations, or companies to support decision-making, operations, or internal storytelling. These can take the form of dashboards, strategic visuals, data tools, or web applications, and are typically tailored to a specific business, governmental or institutional context.
Experimental & Avant-Garde
Bold, unconventional, or artistic visualizations that push the boundaries of form, technique, or concept. These works may explore new mediums, blend disciplines, or challenge what data visualization can be – from aesthetics to interactivity.
Special Note for Students
We strongly encourage students to participate!
Student work published in 2024 or the first half of 2025 (until the end of the spring semester) is eligible.
Please check the “Student Work” box in the submission form.
How does it work?
Visualizations can take any form:
Printed/static
Animated (short films)
Interactive or web-based
On- or offline formats
Participants are responsible for providing access to their work (e.g. links, uploaded files) so that jury members can view and evaluate it in its intended form. All submissions are kept confidential and shared only with the jury.
If selected, the organizing team will collaborate with you to anonymize sensitive data or organizational references before any public sharing.
Both individuals and teams are welcome to submit!
Important Dates
August 18, 2025 – Call for Submissions opens
October 15, 2025 – Submission deadline
November 21, 2025 – Award Ceremony at The Circle, Zurich
Recognition & Visibility
Winners in each category (assuming a sufficient number of submissions) will receive an official Swiss Viz Award and be featured across Data Innovation Alliance communication channels:
Website, LinkedIn, and post-event publications.

Submission Requirements
Make sure your submission includes:
Selected category
Short goal/purpose of the visualization
Defined target audience
Publication date
List of author(s)
Contact person
Optional: Mark as “Student Work” or “Confidential”
Link or PDF/file of the work
Ready to Join?
Bring your visualization to the spotlight!
Submit between August 18 and October 15, 2025 – and be part of the Swiss data visualization community.
The Jury
The full jury lineup includes experts from academia, government, journalism,
and design:

Sebastian Baumhauer
Principal Consultant, D ONE
Sebastian helps organizations build modern data analytics and AI ecosystems. He focuses on empowering business functions to do more with data, promoting decentralization concepts such as self-service analytics, while integrating AI capabilities. Advising on and teaching efficient data visualization is not just a core component of his work, but also his passion. He stands for no-frills, concise data visualization that communicates insights clearly and efficiently in business contexts.

Marina Bräm
Founder & CEO viz. bybraem, and Lecturer
Marina has been running her own studio, viz. bybraem, since 2020. Together with clients and experts, she develops data- and fact-based information and design concepts - both analog and digital. The aim is to convey complex content in an understandable and high-quality way. She previously worked as Digital Design Director and Head of Infographics at Tamedia AG. From 2013 to 2015, she built up the area of large infographics at NZZ am Sonntag. As a lecturer, she teaches at various universities, including ETH Zurich, HSLU and ZHDK.

Sebastian Broschinski
Interaction Designer, Tamedia
Sebastian is an experienced information designer at Tamedia, specializing in cartographic and interactive visual storytelling. He previously led the infographic department and served as deputy art director at Finanz und Wirtschaft. His award-winning work (Swiss Viz Award, Swiss Press Award) brings together design precision and journalistic depth. He studied at Hochschule Anhalt Dessau and ZHdK.

Prof. Dr. Martin Eppler
University of St. Gallen, Communications & Knowledge Visualization
Martin is a professor of communications management at the University of St. Gallen and director of the MCM Institute. His teaching and research focus on knowledge visualization, visual literacy, and data fluency. He has published more than 20 books and over 250 scientific articles, including “How to Talk About Data” (Financial Times Press). His work emphasizes the power of clear and insightful visual communication in professional contexts.

Joana Kelén
Neue Zürcher Zeitung, Visual Journalist and Data Storyteller
Joana works at NZZ’s Visuals team, where she focuses on infographics, illustration, data visualization, and UX design. Her projects aim to make complex topics understandable through clear and engaging visual storytelling. She is committed to clarity, strong narrative structure, and thoughtful design that guides readers through data-rich stories with ease and precision.

Nicole Lachenmeier
Superdot Studio: Co-Founder, Design Lead
As Lead Designer, Nicole shapes visual strategies and design systems that transform complex data into accessible knowledge. Her work bridges design, data, and communication – often beyond conventional chart forms. She is co-author of Visualizing Complexity and teaches information design at various universities. Through initiatives like On Data and Design, she promotes interdisciplinary exchange between design, research, and data practice.

Nicolas Ruetschi
Swiss Federal Statistical Office, Visual Dissemination of Public Data
As Deputy Head of Publishing and Dissemination and Co-Head of the Data Visualisation Team at the Swiss Federal Statistical Office, Nicolas plays a key role in modernizing how public data is shared. His focus lies on automating and harmonizing the visual dissemination of statistics to ensure they are accessible, accurate, and useful for public understanding and decision-making.

Jan Wächter
Interactive Things, Interaction and Data Visualization Designer
Jan leads the design of data-driven applications and visualizations at Interactive Things. He combines data expertise with human-centered design to build tools and narratives that help users explore and understand complex information. His work spans various sectors and always puts usability and clarity at the forefront of innovation.

Anne Wegmann
SBB, Product Owner for opentransportdata.swiss
Anne manages opentransportdata.swiss, Switzerland’s open data platform for mobility, under mandate from the Federal Office of Transport. With a background in geographic information science and visual communication, she advocates for open access to transport data and the power of visualization to turn complex mobility information into actionable insights for all.

The jury is chaired by
Dr. Charlotte Cabane
Managing Consultant, D ONE
and Visiting Professor, University of Lucerne
Charlotte helps organizations harness their data to uncover insights and enable informed decision-making. She advocates for using data visualization as a powerful tool to spark meaningful conversations, foster alignment, and clearly communicate insights across diverse stakeholder groups. Charlotte promotes accessible, purpose-driven visualizations that support people in both their work and daily lives. She is leading the Swiss Viz Award since 2023.

The jury is mentored by
Christian Erni
Head of Data Experience and Management Board Member at D ONE.
Christian is a pioneer of new media communication and has a vast experience at the intersection of information and design. Before joining D ONE, he was Creative Director at international agencies and lecturer for visual design at ZHdK. Christian presides 16 years the Best of Swiss Web (Creation Jury) and was juror at the New York Festivals and Eurobest. Christian is the D ONE communication director and is heading its data experience practice.
Impressions from year 2024
-
![A group of people standing on stage at an awards ceremony, holding plaques and certificates. A large screen behind them displays the Swiss VIZ Award logo, with the Data Innovation Alliance logo on the left and the YouTube logo as a presenting partner on the right. The stage is decorated with large flower arrangements on either side, and the venue has a vaulted ceiling with purple lighting.]()
ALL WINNERS
-
![A award certificate for the Swiss Viz Award 2024, with the word 'Visualization' over a colorful Venn diagram on a black background and gold-colored text section listing the winners and contributors, including Nicole Lachenmeier, Darjan Hil, Lilia Rusterholtz, Aaron Ritschard, Sarah Heitz, and others.]()
WINNER VISUALIZATION
-
![Three people on stage during an award ceremony or presentation. The woman on the left holds a plaque with a rainbow-colored circle and the text 'SWISS AWARD 2022 WINNER'. The man in the middle speaks into a microphone, and the woman on the right, dressed in a light gray blazer, smiles and holds a booklet or program.]()
YESS!
-
![Flowchart infographic of egg production process, including laying hen housing, egg collection, internal production, processing, packaging, and distribution. Includes diagrams and data on chicken numbers, eggs produced, and farm details.]()
WINNER VISUALIZATION
-
![Award certificate for Swiss VIZ 2024 winner, recognizing Buol Flemming for a timeline project, with colorful visualization graphic at the top.]()
STUDENTS VIS - WINNER
-
![Map of a large urban park with pathways, gardens, and open green spaces. The park is surrounded by city buildings and streets. There are many black dots indicating data points scattered throughout the park.]()
STUDENTS VIS - WINNER
-
![Cover of the Swiss VIZ Award 2024 winner, Annabelle Vuille, titled "Dumped: The Truth about Europe’s Plastic Recycling." The cover has a black background with a colorful, blurred, circular graphic and text indicating the award and title.]()
STUDENTS VIS - WINNER
-
![An art gallery with three posters on the walls about plastic waste, including a pyramid-shaped infographic, a flow chart, and a map of regional plastic waste issues, and a white sculpture in the foreground.]()
STUDENTS VIS - WINNER
-
![Group of women at an event, exchanging gifts or awards, smiling and dressed in business casual attire with name tags.]()
WINNER
-
![Poster announcing the Swiss VIZ Award 2024 winner for the project titled 'Es ist so viel Hass da' by Simone Rau, Anielle Petherans, Patrick Meier, Sebastian Broschinski, Oliver Zihlmann, affiliated with Tages Anzeiger / Tamedia, featuring a colorful blurred circle graphic and a gold-colored background.]()
Winner Data Story
-
![Infographic showing colored dots representing men, women, and divers, with a caption in German reporting on personal attacks experienced during parliamentary work and the number 549.]()
Winner Data Story
-
![Award certificate for Swiss VIZ Award 2024 winner, with a colorful logo and text details about the award and recipients.]()
Winner Dashboard
-
![Screenshots showing poll results related to pension initiatives in Switzerland, with maps of Switzerland highlighting different regions. The left map shows results for a pension initiative with more green indicating acceptance, and the right map shows results for another pension initiative with more purple indicating rejection.]()
Winner Dashboard


